Retail sales, Great Britain: January 2026

Retail sales rose in the three months to January 2026, according to our first estimate.
Table of contents
- Overview
- Retail sales in January
- Retail sector volumes
- Online retail values
- Data on retail sales
- Data sources and quality
- Cite this statistical bulletin
Print this statistical bulletin
1.Overview
The quantity of goods bought (volume) in retail sales is estimated to have risen by 0.1% in the three months to January 2026, compared with the three months to October 2025. The rise was because of better automotive fuel sales over the three months to January 2026, and a good start to the year for non-food stores, which was only partly offset by falls in supermarkets.
Retail sales volumes are estimated to have risen by 1.8% in January 2026, following a rise of 0.4% in December 2025 (unrevised from our previous publication) and a fall of 0.4% in November 2025 (revised down from a 0.1% fall in our previous publication). Growth in January 2026 was partly because of artwork and antiques sales, alongside continued strong sales from online jewellers.Back to table of contents
2.Retail sales in January
Sales volumes rose over both the month and the three months to January 2026
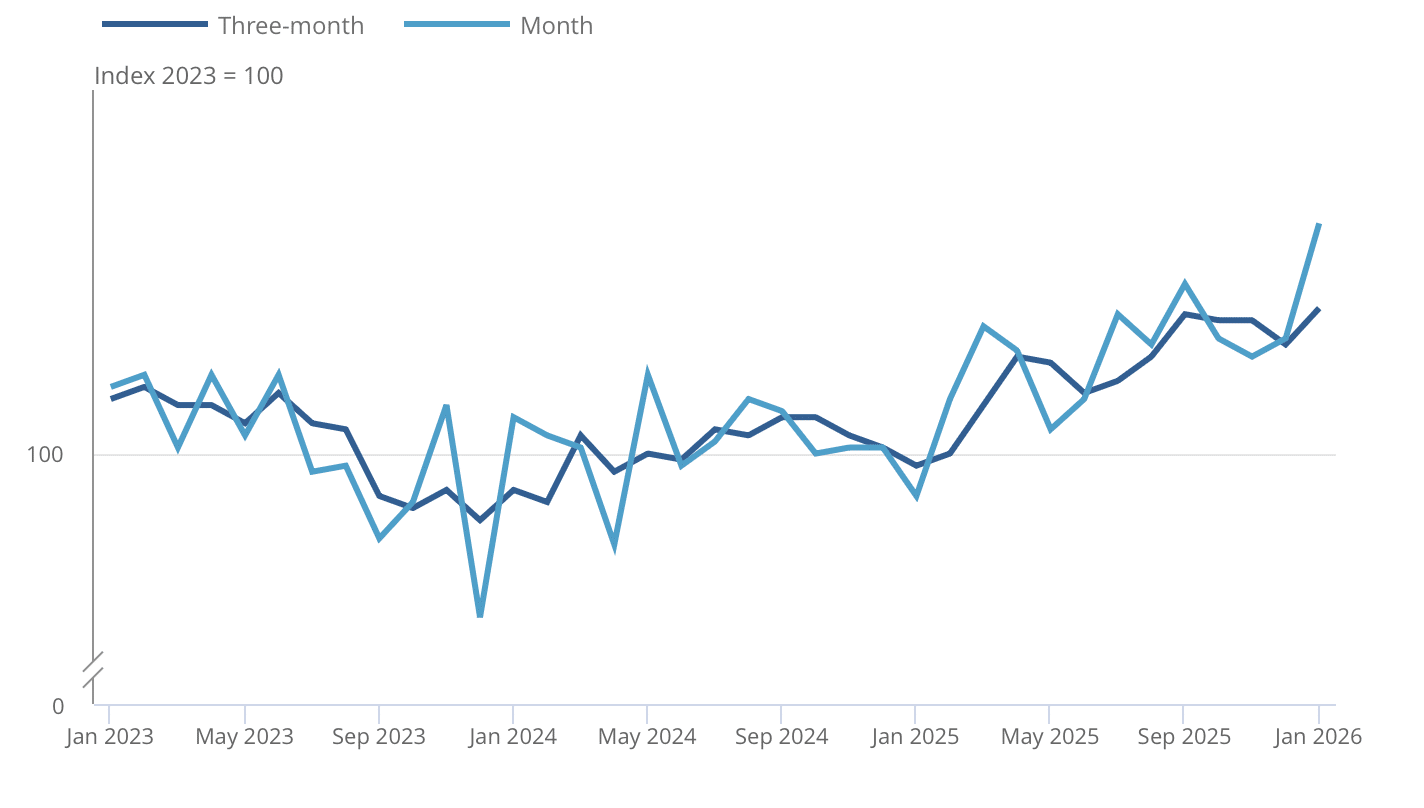
Rolling three-month and monthly index for the quantity bought in all retailing, seasonally adjusted, Great Britain, January 2023 to January 2026
Source: Monthly Business Survey, Retail Sales Inquiry from the Office for National Statistics
Notes:
- The chart shows the quantity bought in retail sales over time, for both the rolling three-month and the monthly movements.
- The monthly path shows more volatility than the smoother three-month series.
Download this chart Sales volumes rose over both the month and the three months to January 2026
Sales volumes rose by 0.1% in the three months to January 2026, compared with the three months to October 2025. Sales volumes were 2.6% higher than in the three months to January 2025.
Sales volumes rose by 1.8% over the month during January 2026, which was the largest monthly rise since May 2024. This followed a rise of 0.4% in December 2025. Sales volumes rose by 4.5% over the year to January 2026.
Compared with their pre-coronavirus (COVID-19) pandemic level in February 2020, January 2026 volumes were flat, at 0.0%.
These data are available in our Retail Sales Index dataset.Back to table of contents
3.Retail sector volumes
Automotive fuel and non-food retailers’ sales rose over the three months to January 2026
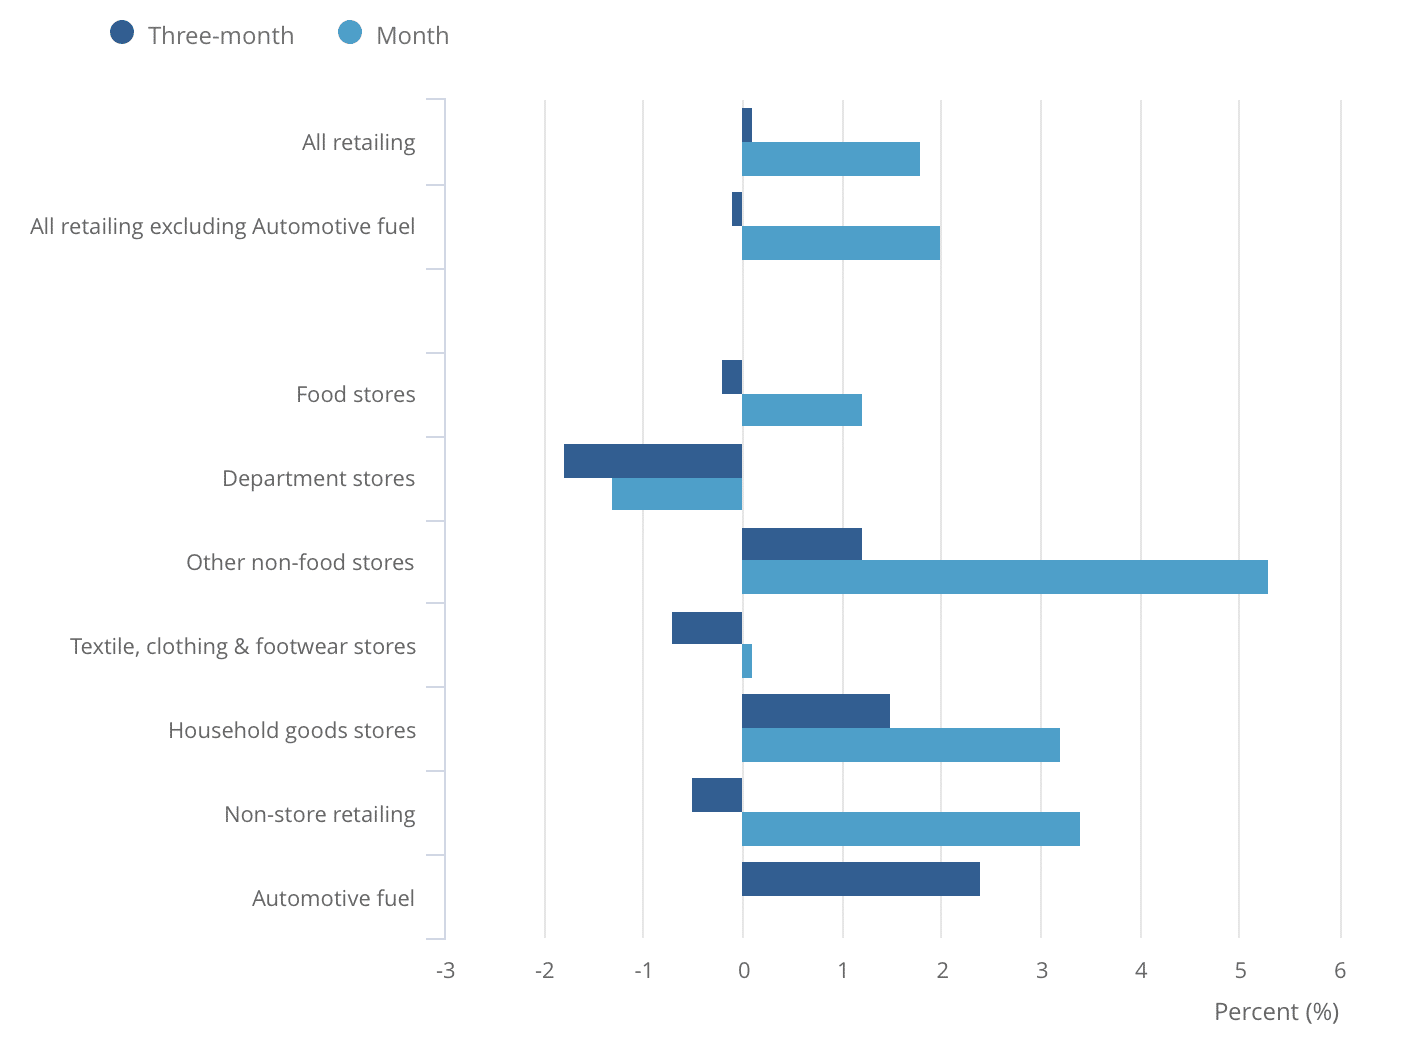
Volume sales, three-monthly, and monthly percentage change, seasonally adjusted, Great Britain, January 2026
Source: Monthly Business Survey, Retail Sales Inquiry from the Office for National Statistics
Notes:
- Monthly growth rates can be volatile. Monthly growth should therefore be used with caution and alongside other measures, such as the three-month growth rate.
- Non-store retailing refers to retailers that do not have a store presence. While the majority is made up of online retailers, it also includes other retailers, such as street stalls and markets.
- More data are available in our Retail Sales Index datasets.
Download this chart Automotive fuel and non-food retailers’ sales rose over the three months to January 2026
Sales volumes rose 0.1% over the three months to January 2026. This was partly because of automotive fuel sales, which fell in October 2025, but rebounded in November. Non-food stores (the total of department, clothing, household, and other non-food stores) also rose over the three months to January. This was partly because of strong sales volumes in commercial art galleries during January 2026. Computer and telecoms retailers also saw a sustained strong performance since September 2025. Household goods stores also grew, which retailers attributed to good January seasonal sales for furniture, and there was a strong November 2025 period for hardware stores. This was partly offset by falls in supermarkets and department stores.
Sales volumes rose 1.8% over the month to January 2026. Other non-food stores had a good month as auctions of items such as artwork and antiques drove volumes. Mail order retailers, which are predominantly online, experienced a boost from retailers selling sports supplements, as well as continued strong sales volumes by online jewellers. Comments from jewellers reported that demand had hit unprecedented levels.Back to table of contents
4.Online retail values
Online sales rose in January 2026 despite falls across non-food stores
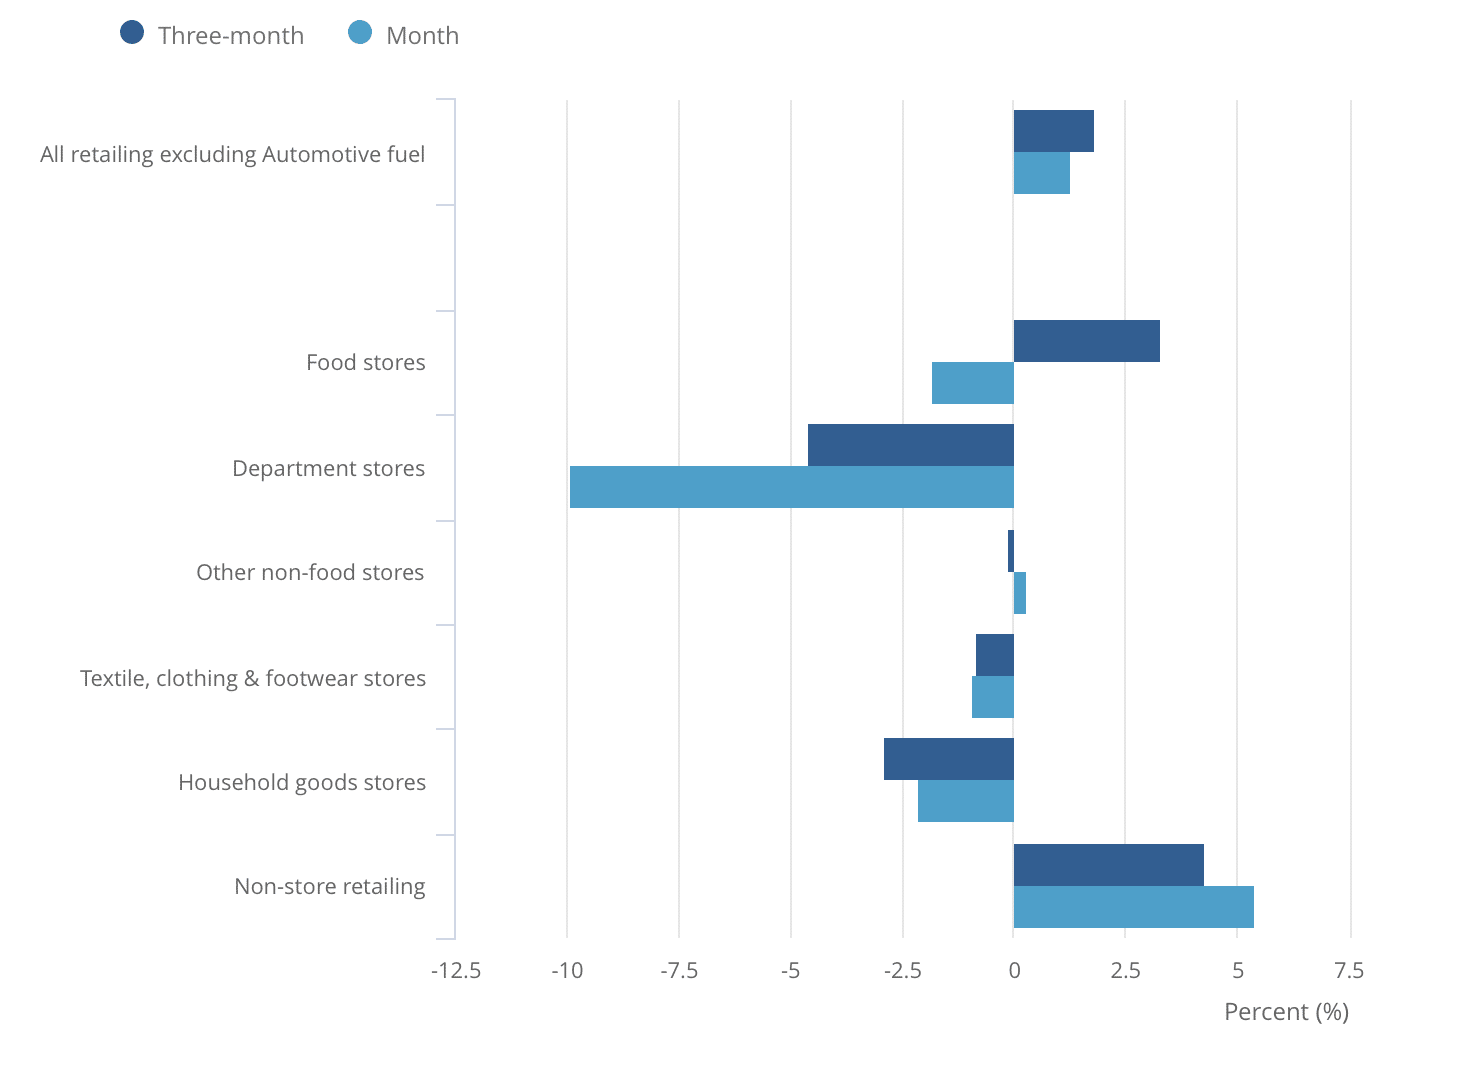
Value sales, three-monthly, and monthly percentage change, seasonally adjusted, Great Britain, January 2026
Source: Monthly Business Survey, Retail Sales Inquiry from the Office for National Statistics
Notes:
- Monthly growth rates can be volatile. Monthly growth should therefore be used with caution and alongside other measures, such as the three-month growth rate.
- Non-store retailing refers to retailers that do not have a store presence. While the majority is made up of online retailers, it also includes other retailers, such as street stalls and markets.
- More data, such as the proportion of sales made online, are available in our Retail Sales Index internet sales datasets.
Download this chart Online sales rose in January 2026 despite falls across non-food stores
The amount spent online, known as “online spending values”, rose by 1.8% when comparing the three months to January 2026 with the three months to October 2025. It rose by 10.8% when comparing the same period with the three months to January 2025.
Within the monthly series, online sales values rose by 1.3% over the month to January 2026, and by 14.7% when comparing January 2026 with January 2025. This was the largest year-on-year rise since April 2021, as online sales fell on both the month and the year in January 2025.
The Met Office Weather and Climate summaries explain that the UK had above average rainfall in January 2026, but below average rainfall in January 2025. According to our UK retail footfall dataset, footfall was down in January 2026.
Total spend (the sum of in-store and online sales) rose by 1.6% over the month. As a result, the proportion of sales made online fell from 28.3% in December 2025 to 28.2% in January 2026.Back to table of contents
5.Data on retail sales
Retail Sales Index
Dataset | Released 20 February 2026
A series of retail sales data for Great Britain in value and volume terms, seasonally and non-seasonally adjusted.
Retail sales pounds data
Dataset | Released 20 February 2026
Total sales and average weekly spending estimates for each retail sector in Great Britain in thousands of pounds.
Retail Sales Index internet sales
Dataset | Released 20 February 2026
Internet sales in Great Britain by store type, month, and year.
Retail Sales Index categories and their percentage weights
Dataset | Released 28 March 2025
Retail sales categories and descriptions, and their percentage of all retailing in Great Britain. Back to table of contents
6.Data sources and quality
For January 2026, the Retail Sales Index (RSI) survey response rates were 57.2% based on returned forms, which is 4.3 percentage points below the average of the past 12 months. This accounted for 91.5% of total turnover coverage of the sample population, 2.8 percentage points above the average of the past 12 months. Historical response information is available in our Retail sales quality tables dataset.
Information on how we calculated the data, including strengths and limitations, and a glossary of relevant terms, is available in our RSI quality and methodology information (QMI).
Seasonal adjustment
Seasonally adjusted estimates are derived by estimating and removing calendar effects (for example, Easter moving between March and April) and seasonal effects (for example, increased spending in December because of Christmas) from the non-seasonally adjusted estimates.
We use the X-13ARIMA-SEATS approach to seasonal adjustment. Seasonal adjustment parameters are monitored closely, and are regularly reviewed. Improvements following our annual seasonal adjustment review have been implemented in this release. More information is available on our Seasonal adjustment methodology.
Seasonal adjustment is applied at the industry level, and the seasonally adjusted series are aggregated to create estimates by industry sector and total retail. As part of our quality assurance approach, residual seasonality checks are completed regularly by our time series analysis team on both the seasonally adjusted series and the indirectly derived aggregate time series. Based on current data, we find no residual seasonality in the main aggregate for monthly retail sales estimates.
Source: Contracts Finder licensed under the Open Government Licence v.1.0.

